12 Mar ’24–10:43 candle gives me cold shivers! — Nifty & BankNifty PostMortem Analysis
Nifty Analysis — Stance Bullish ⬆️
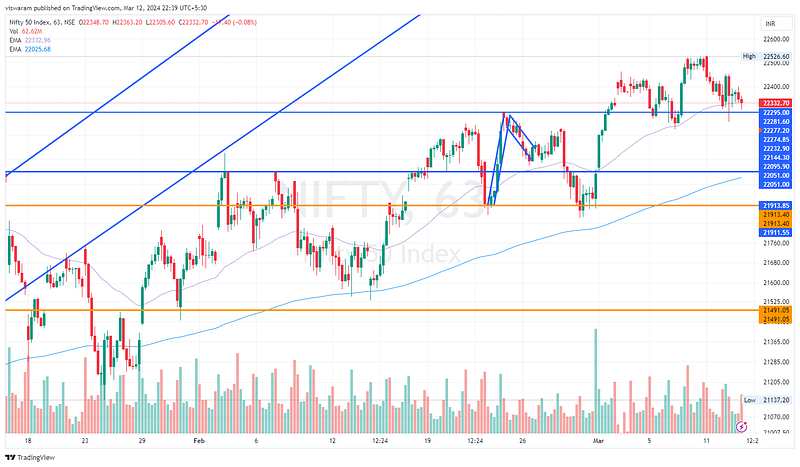
Recap from yesterday: “If Nifty50 has to change its character, the price has to fall below 22295 and then below 22051 wherein the higher low will get violated.”

I was stunned by the Nifty50 and BankNifty price moves today. We started the day in line and then the 09.31 GREEN candle surprised me, a quick surge that took Nifty50 up by 134 points ~ 0.6% by 10.15. What followed was even scarier: a fall of 194 points ~ 0.87% by 10.43. A single candle moved 131 points ~ 0.59%. When was the last time you remember seeing Nifty move that much in a single 4-minute candle? We briefly violated the support of 22295 but got back in a quick time. From there on Nifty50 had no more aggressive swings and managed to close flat today.
On the higher time frame, the stance continues to remain bullish. As long as 22295 support holds, there is no meaning in revising the stance. One thing is sure, the sudden price moves we are seeing right now are quite indicative of a massive shift in fundamentals. Technical Analysis cannot detect the directional impact this early, but it would be prudent to keep an eye out for any possible clues. The small caps -1.98% and mid caps -2.55% are bleeding RED, and even some Nifty sub-sectors are also down by quite a bit — Realty -3.71%, PSU Banks -2.57%, media -1.85%, Metals -1.73%.
BankNifty Analysis — Stance Neutral ➡️
The 10.43 candle was more profound on BankNifty, we had a drop of 656pts ~ 1.38% in that single candle. We had a positive swing of 612pts ~ 1.3% between 09.27 to 09.59 and then a negative reaction of 931pts ~ 1.95% between 09.59 to 10.47. If these 2 swings did not take out your stop loss — then I don’t know what will. Since we run algo trades, the entire positions went into a tailspin showing a huge MTM loss. Miraculously, the system recovered and ended the day with a reduced loss. If this same move happened on a Wednesday or Thursday, then the losses would have been 10x of what we had today.

On the higher time frame, the stance continues to be neutral as BN was unable to take out the 47465 resistance today. The 10.18 candle showed some bearish intent, but it did not get any follow-through action. The current market texture is weak hands holding CE short positions. So if we break the resistance tomorrow either by a gap-up or via 1hr trading, then the short covering will result in further momentum. This market structure is really pissing off some serious traders too, mostly because overnight positions are not bringing the kind of benefit it should. The premiums for which they are sold do not cover the risks taken.

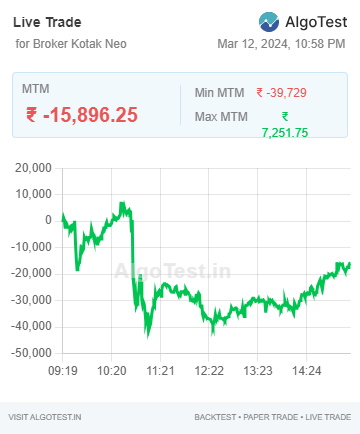
Algo Trading
Our algo trades ended today with a loss of 15896. The positions went into deep RED during the 10.43 candle, but with time the positions started recovering.
Webhooks automation run via TradingView on Dhan