18 Jan ’24 — FIIs sold 20000 crore in 2 days? — Nifty & BankNifty PostMortem Analysis
Nifty Weekly Analysis
Between the last expiry and today, Nifty has only fallen 191pts ~ 0.88%. This does not seem to showcase what really happened during this week. We hit a new lifetime high of 22124 and then fell 839pts ~ 3.8% in 2 days. Something that we rarely see with Nifty.

Nifty Analysis — Stance Bearish ⬇️
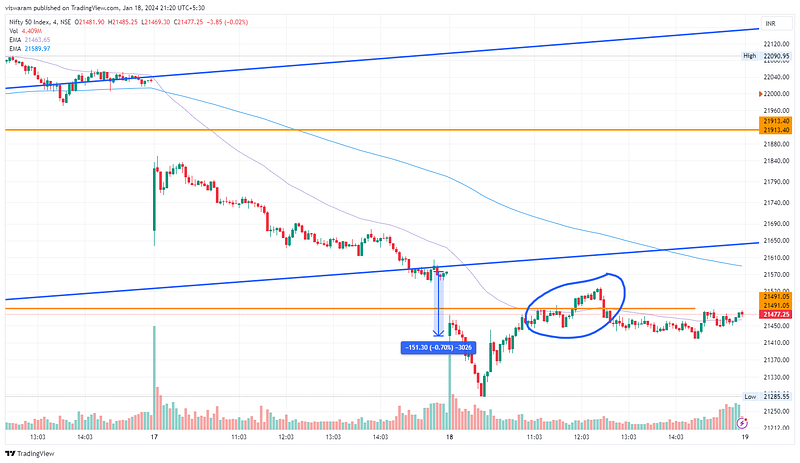
The gap down ensured we broke the support at 21491. Further price action suggested that we may have some deep cuts today, but strangely Nifty reversed right at 10.00 at 21285 level. Not sure whether it was DIP buying, but we went past the resistance zone of 21491 by 11.59. Nifty did not have enough strength to get back into the ascending channel — but it managed to close near the SR level showing some respite.
FIIs sold over 20000 crores of equity over the last 2 days. When was the last time we had this high volume of selling? 20–25k crore is the approx. volume of transactions they do for a whole month — we got that in 2 days. What do they know that we retail traders don’t?

Today’s price action has confirmed that the channel is broken, but not the support/resistance of 21491. If Nifty trades above 21491 in the morning session — the bears may really feel abandoned. Ideally, the next stop should be 21041 — that was where Nifty bounced off from the trendline on 21st Dec 2023. Our stance continues to be bearish until proven wrong.
BankNifty Analysis — Stance Bearish ⬇️
What happened with BankNifty today was more or less as per the script. The opening 4mts gave us some idea of what to expect, the reason being the bounce from 45399 support. Even though the opening was gap-down, adequate selling pressure was not there to take out the support level. Ideally, it had to be taken out via the gap itself — and that did not happen.
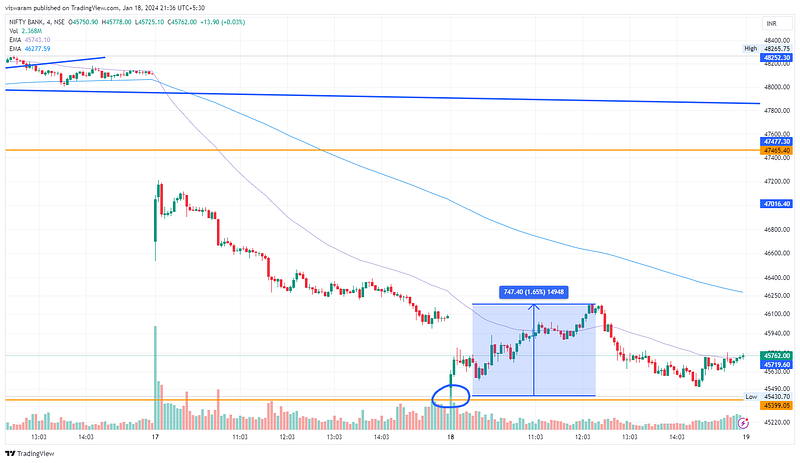
BN impressed with a midday rally of 747pts to close the gap. Later it gave away 58% of those points to close at 45762, down 350pts ~ 0.76% vs yesterday. We would not know how long this correction phase persist, deep down — we prefer to see a broader bear rally.
There is a thing or two about the bear market. Have you seen videos of how Bear catches fish in the river? It goes to those areas called rapids where the Fish has to jump to escape the current. The bear has to just stand at those levels with his mouth wide open — the fish automatically goes straight in as it cannot maneuver mid-air. Bear market price action is more or less similar — the retail traders are helpless and out of the driving seat. If they survive, it will just be at the mercy of the big boys.

The stance is still bearish and the first target is 45399 and it has to be taken out pretty soon. The longer we wait out, the dip buyers will re-emerge. Other support areas nearby are 44542 and 44068 — if the momentum carries, then we should be testing them this month itself.