18th Oct ’23 — Vertical fall from a strong zone — PostMortem on Nifty & BankNifty
Nifty Analysis

The pre-open did not show any indication for the day that followed, even the open was inline. The first candle was quite strong in RED, but it bounced off the support line of 19776. By 10.05 we were back to 19840 levels and looking strong. Even though the 19700 PEs were trading in the cheap 20 to 22 range — I was not interested in buying thinking it would go worthless. What followed was totally uncalled for. We started falling quite brutally, the support was taken out by 10.50, the intensity really picked up and we hit an interim bottom at 12.30 ~ 19674 levels. As we discussed yesterday, the charts did not indicate this movement — it looked pretty bullish to me. What happened today was that my long position went into loss and then I had to go short to go with the trend.
The second leg of the fall took out 65pts ~ 0.33% after we climbed to the 19720 levels. The 2nd leg was stalled by time — else we could have seen more action.

On the 1hr TF, I wish to change my stance from bullish to neutral but with a bearish bias. The rationale being the intensity of the 10.15 candle that cut through the support. That candle looks purposefully planted to bring a bearish bias. If we start moving downwards tomorrow, my first target will be 19600 followed by 19529. In case we reverse, the first step would be to take out the resistance of 19776.
BankNifty Expiry Analysis
Between the last expiry and today, BankNifty lost 630pts and almost 82% of that came today. Interestingly the stable support level of 44068 is now breached. Remember we went below this level on 31-Aug, 04-Oct and 09-Oct and we managed to climb back every time. Will it be different this time?

BankNifty Today Analysis
The leader during reversals is always BankNifty and it is visible today also. Nifty had a similar opening candle, but the next few minutes were negating it and moved up. BankNifty on the other hand did not go up strongly. The fall from 44390 was almost 519pts ~ 1.17% which cut through the support of 44068 with so much ease. Remember this was the same support zone that had rejected all 4 prior fall attempts.
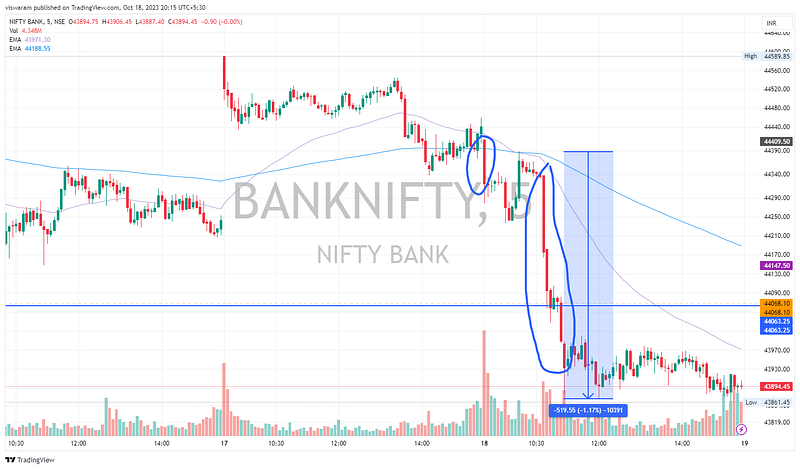
After falling below the 44068 levels, there was no attempt to climb back — a sign that bulls may have lost control. If it stays below this level for tomorrow, the selling is just going to intensify.

On the 1hr chart, the 10.15 candle that took out 422pts ~ 0.95% stands highlighted. Never before did we have such a strong candle right at the support area — going by the intensity, looks like further move may come on the downside instead of rejection. What really caused this panic selling? Not sure. Surprisingly the India VIX is still at 10.96 and US VIX is at 19.00 — the gap between them is a whopping 73.3%.
Ideally, the implied volatility has to pick up for strong downward price action. A glimpse of that was very much visible in the options prices today. Going by the options flow and since we broke the support, I wish to change my stance to bearish. My first target would be 43735 and then 43519.