16 Jan ’24 — Nifty Tests the Ascending Channel Today — Nifty & BankNifty PostMortem Analysis
Nifty Analysis — Stance Neutral ➡️
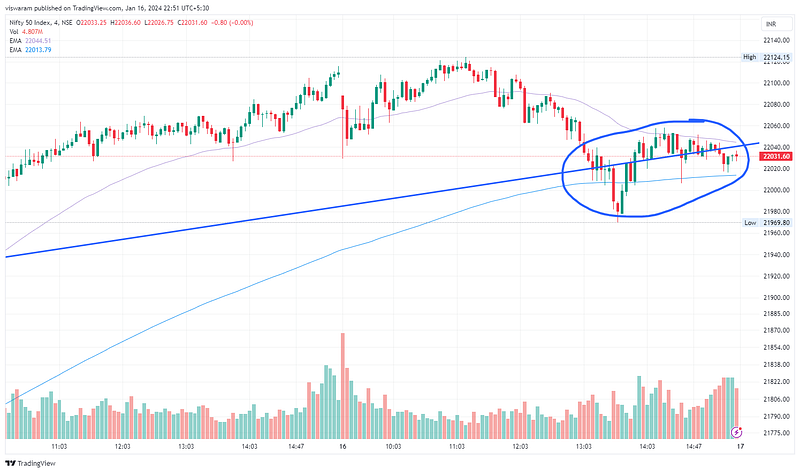
Nifty hit a new top of 22124 today and just when everything was going in its favor, it started falling. Most analysts will blame the NiftyIT sector (-1.28%) for the fall today — they are not wrong but it is not just because of IT. The majority of the Nifty sub-sectors were down today, Realty (-1.66%), Pharma (-1.14%), Energy (-0.75%), Service (-0.52%). Very few sectors were in green today — Metal, Media, Consumer Durables, PSU banks, etc. When the majority of sectors are against the primary direction (bullish), it may end up becoming a top-like formation.

We discussed yesterday how the Ascending Channel will act like support, on the 4mts TF we got a breach today. 22050 was our laxman rekha but we ended up hitting 21969.

The channel top is not breached in the higher TF, just because of this we are not changing the stance from bullish to bearish. We would like to give one more opportunity for Nifty to hold its ground. We would start the day tomorrow with a neutral bias and wait for Nifty to fall below 21913 to go bearish.
BankNifty Analysis — Stance Neutral ➡️
BankNifty was sailing smoothly till 12.59 today when it fell below a weak trend line. Till then it was holding its end of the bargain when the sectors around it were falling, most noticeably NiftyIT. Yesterday we changed the stance of BN from neutral to bullish — but we did not get the required pump-up today, hence we are reverting back to the neutral stance.

BN fell close to 302pts ~ 0.63% between 12.03 and 13.35 — it was during this phase that it breached the shallow trend line. Even though that trend line is insignificant in the grand scheme of things, it may be more than enough to discourage the weak bulls. Surprisingly, BN did not fall below the 47996 zone which would have meant pure bearishness.

The chart may look complex with many lines crisscrossing, but it is simple to understand. The line connecting 47010 to 48265 is the shallow trend line formed due to the bullish move from the 10th of Jan. The flatter downward-sloping line from the ATH & connecting the peaks is a bearish trend line. Right now BN is below the bullish line and above the bearish line, if it falls further we go into the bearish zone. If the chart felt too complicated — drop in a comment & we will be happy to help.