17th Oct ’23 — Nifty Breaches Resistance Zone — PostMortem on Nifty & BankNifty
Nifty Analysis
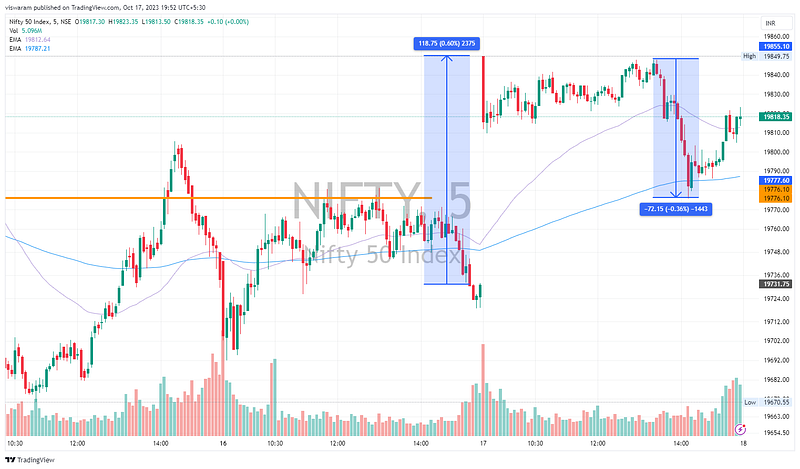
Nifty got a mega boost by the gap-up open of almost 118pts ~ 0.6%. Since it took out my resistance zone, I had to change my bias from neutral to bullish. Interestingly Nifty looked strong till 13.20 after which it shed 72pts ~ 0.36% in 50mts. Despite that misadventure, we still respected the support of 19776. The final closing was also quite good and above the 19800 levels.
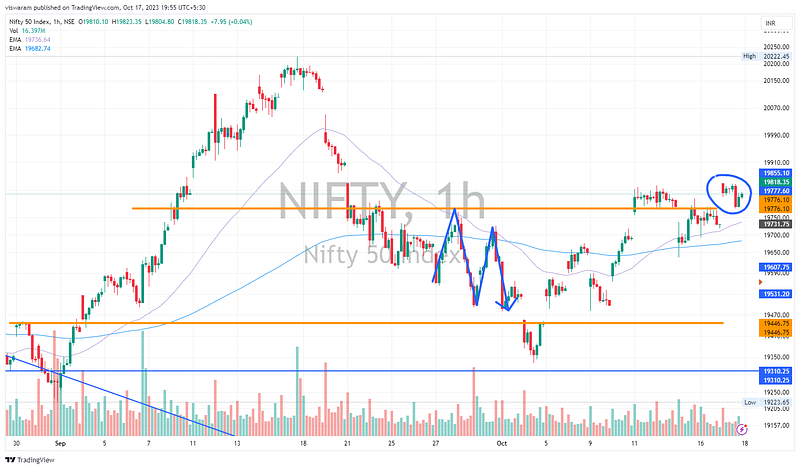
On the 1hr TF, we have formed an island just above the 19776 levels. Today’s swing high has taken out the highs of 12th October. I wish to continue with my bullish stance as long as the support of 19776 is respected. Ideally, the next target should be 19907 and then 19998 if we are going up.
Not sure why, but our markets are looking bullish despite a war in the Middle East, surging gold, surging crude oil, and surging treasury yields in the US. Why are Indian stock indices insulated from these multi-headed shocks? Either the fundamentals are not bad or the technicals (charts) have not priced in these anomalies. As a technical trader, the only option for me is to follow the charts even while knowing something’s off. India VIX @ 10.69, US VIX @ 17.88
BankNifty Analysis
BankNifty also had a similar chart pattern as of Nifty50. A gap-up open of 345pts ~ 0.78% and then a steady period till 13.20. Fell 208pts ~ 0.47% in 50mts and then recovered for close.

HDFCBK did quite well even after the declaration of the results. The gap-up on hdfcbank was the main reason both Nifty and BankNifty had an unusual start. In fact HDFCBANK had a similar chart as that of BN as well as N50, except for the period 13.20 to 14.10 wherein HDFCBK fell only 0.38%. The fall in Kotak, ICICI, AXIS were quite strong in that period — is it telling us something?

Yesterday also we decided to go with a neutral stance, today we are sticking by that again. Despite the gap-up today we were not able to break through the 44650 zone i.e. above the double top level. For bullish momentum to pick up, the only thing BN has to do is negate the double-top zone. If we are falling, the level to watch out for is 44068.