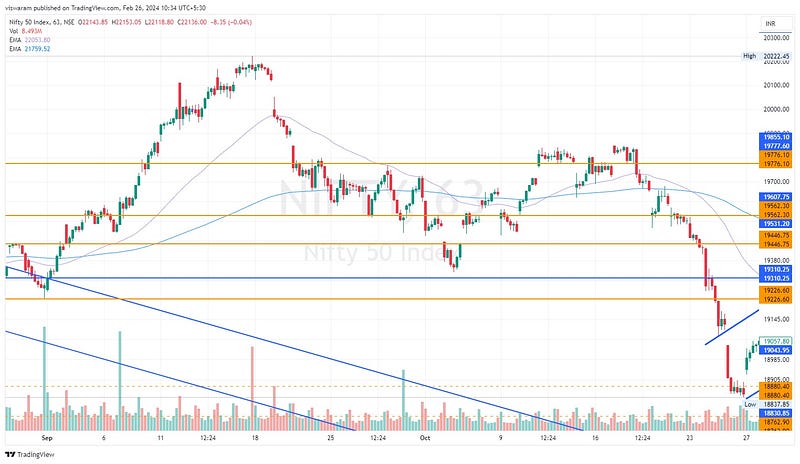
The concept of support and resistance.
Supports are areas where the stock will take a pause — because more people will be interested in buying.
Resistances are areas where the stock will pause, but this time more people are interested in selling.
Supports will appear below the current traded price and resistance will appear above.
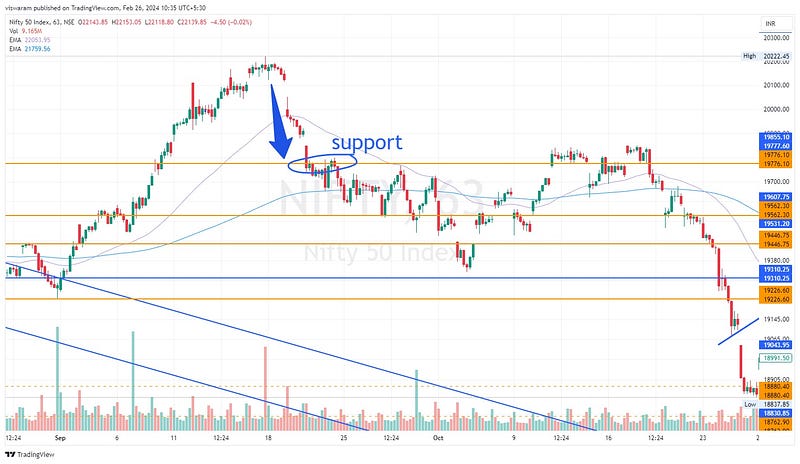
When the price was falling. 19776 acted as support and it delayed
the fall (see encircled area).
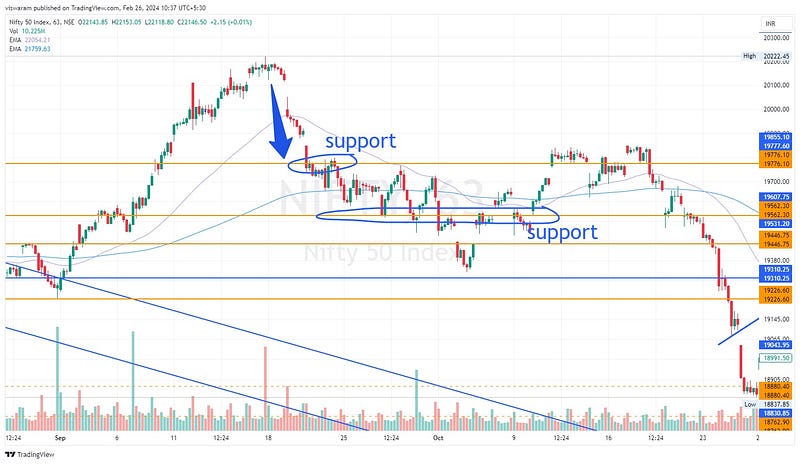
Now look at support2 at 19562 levels. the buyers were able to hold that position for quite a long.

Similarly, when the price is moving up, the sellers will try to prevent it from going further up, those areas are resistance.
The same line can behave as support & resistance depending on where the stock is. Also, the chartist draws these levels which could vary from person to person. You can also try drawing lines on the chart and save its layout so that you can verify what will happen next when the stock reaches that price level.