Today we will discuss how we can combine 2 moving averages and create a more accurate signal of…
It is called the moving average cross-over technique.
Steps to get this indicator
1. open the chart of your favorite stock
2. Add 50 EMA indicator
3. Add 200 EMA indicator
4. check for the crossings

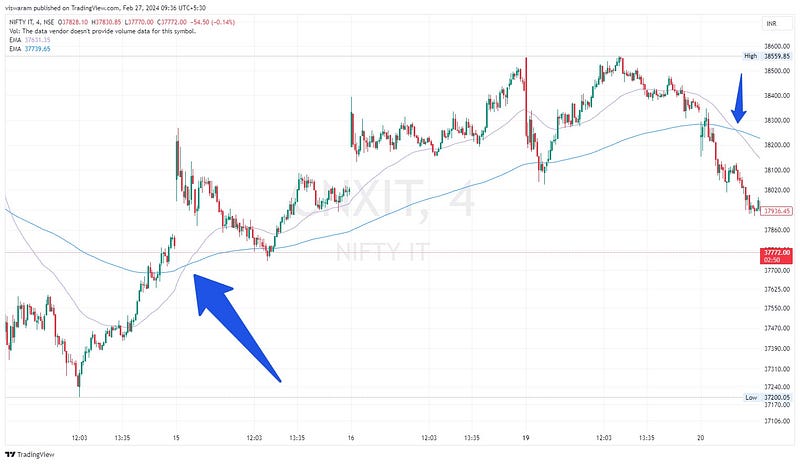
In the above chart, the purple line is 50 EMA and the blue line is 200 EMA. When 50 EMA cuts 200 EMA from bottom to top — it is a buy signal.
And when 50 EMA cuts from top to bottom on 200 EMA — it’s a sell signal. 2 moving average crossover technique is much better than a single EMA.

You can also try plotting these on your charts and check if it is working or not.
